First and foremost, don't panic. CSV is just the acronym (comma separated values) for a type of simple spreadsheet that can be easily created and modified in Microsoft Excel, Google Sheets, or any other spreadsheet application. The instructions for saving a CSV file are at the end of this document. Several templates are available for convenience and can be downloaded from our site once you register. Now on to the rest of the instructions.
Before we begin with the spreadsheet fun, it is crucial to discuss our framework. We, and most of the venture capital industry, believe in segmenting your customers, products, or services. Segmentation means splitting your customers, products, or services up into distinct groups by at least an evident (and hopefully measurable) characteristic. One of the simplest for of segmentation is location. The customers in one state or city will probably be different in many ways from another. If geography impacts your business, for example, in the prices you can charge or how many customers you can reach, you can create a different line or segment for each group. This is the first column of the spreadsheet and one of the most important decisions you can make. Fortunately, thanks to Finply's simplicity, you can experiment with different ways of dividing your customers. And you probably should, this one of the better ways of exploring your customers and products.
Now onto the spreadsheets, the most important technical aspect is: DO NOT CHANGE THE COLUMN NAMES. If you do this the app will not work properly, in the output you’ll get properly formatted names for them. With this in mind, we have provided several examples you can download here ( https://site-14725931361.helphub.io/articles/38410624344 ). These will be your base to build your revenue model. We have filled them with some sample information to help you, but it should modify your input. It has eight columns which are explained below:
1) Segment: This column refers to how you would like to divide your customers. This is done geographically, sales for Maryland and Virginia, for example. Or it can be done by product, coffee, ice cream, and donuts. Or both, or neither, your way is probably different, and our technology allows you the freedom to decide.
2) Opportunity: How many potential customers are there for your products in each category? Another common term used to describe opportunity is "Total Addressable Market" or TAM. This can vary by segment and by-product. Research this will help you tremendously as it's one of the most critical questions venture firms will ask you.
3) MarketShare: What percentage (10 of 100 is 10%, as is 5 out of 50 or 2 out of 20) of the total customers will you be able to sell to in the first month? Again, this is for each given segment. You'll be able to put forth your conclusion, and this can be changed as you gather customer insight.
4) UnitSales: It's the number of clients or sales you'll have for each segment's first month. This will be calculated for you once you've entered "Opportunity" and "MarketShare" values.
5) Price: How much are you charging for each "User" (or client or product)? This is also called the average order value or AOV. You'll be able to adjust this significant variable with a single click within the app.
6) MonthlyRevenue: This will be calculated by multiplying the number of customers by the price you're charging them. More importantly, it's the amount of money you'll receive each month for each segment.
7) StartMonth: When will you begin selling to a given category? For example, will you start at the same time in Virginia as Maryland? Or will you focus on Maryland for the first month and start Virginia in the second month? It's all up to you, but identifying early adopters (your first customers) correctly is crucial for success. Because of this, many funding processes will require that you have researched and created a plan that states which segment will be your first target.
8) CMGR: Compounded Monthly Growth Rate. Apologies for the acronym, but it was necessary. How much will your sales grow from month to month? This too is easy to modify within the app, but you might want to start how rapidly you can scale. A 10% growth means sales about double each year, while a 20% growth rate means sales double roughly every six months.
Thank you for making it to the end with us, it might be confusing here, but running through it with the app will simplify the process. If you have additional questions, please visit our help center (help.finplyapp.com) to help with the most common issues. If your model is more complex or you require further assistance, please subscribe to get personalized on-boarding and customization.
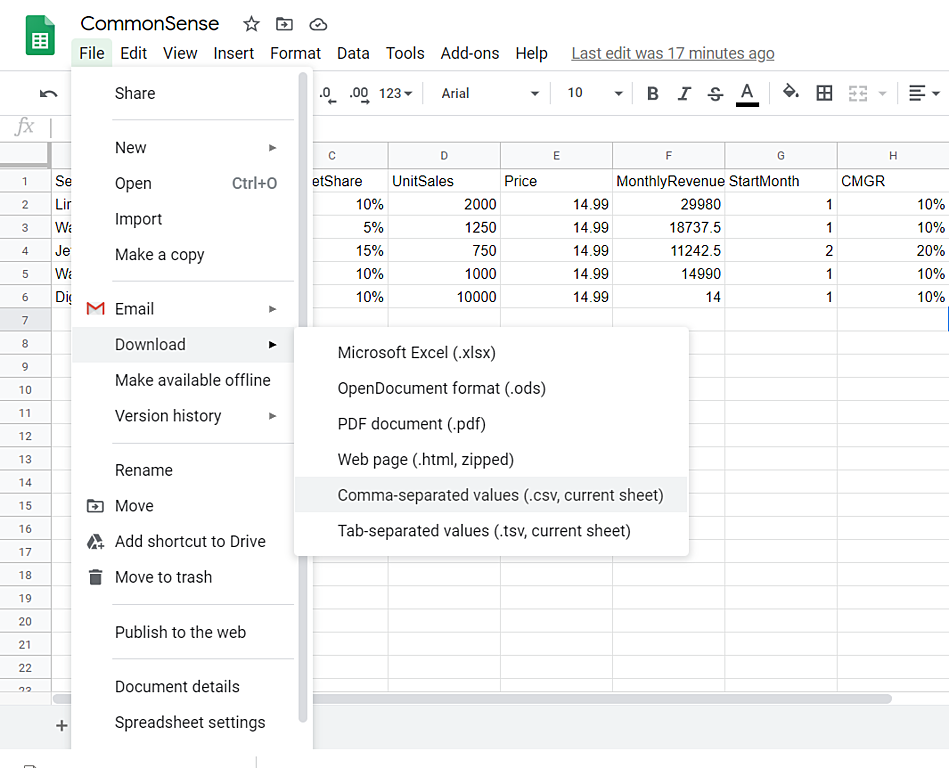
Saving sheet as .csv file from Google Sheets: